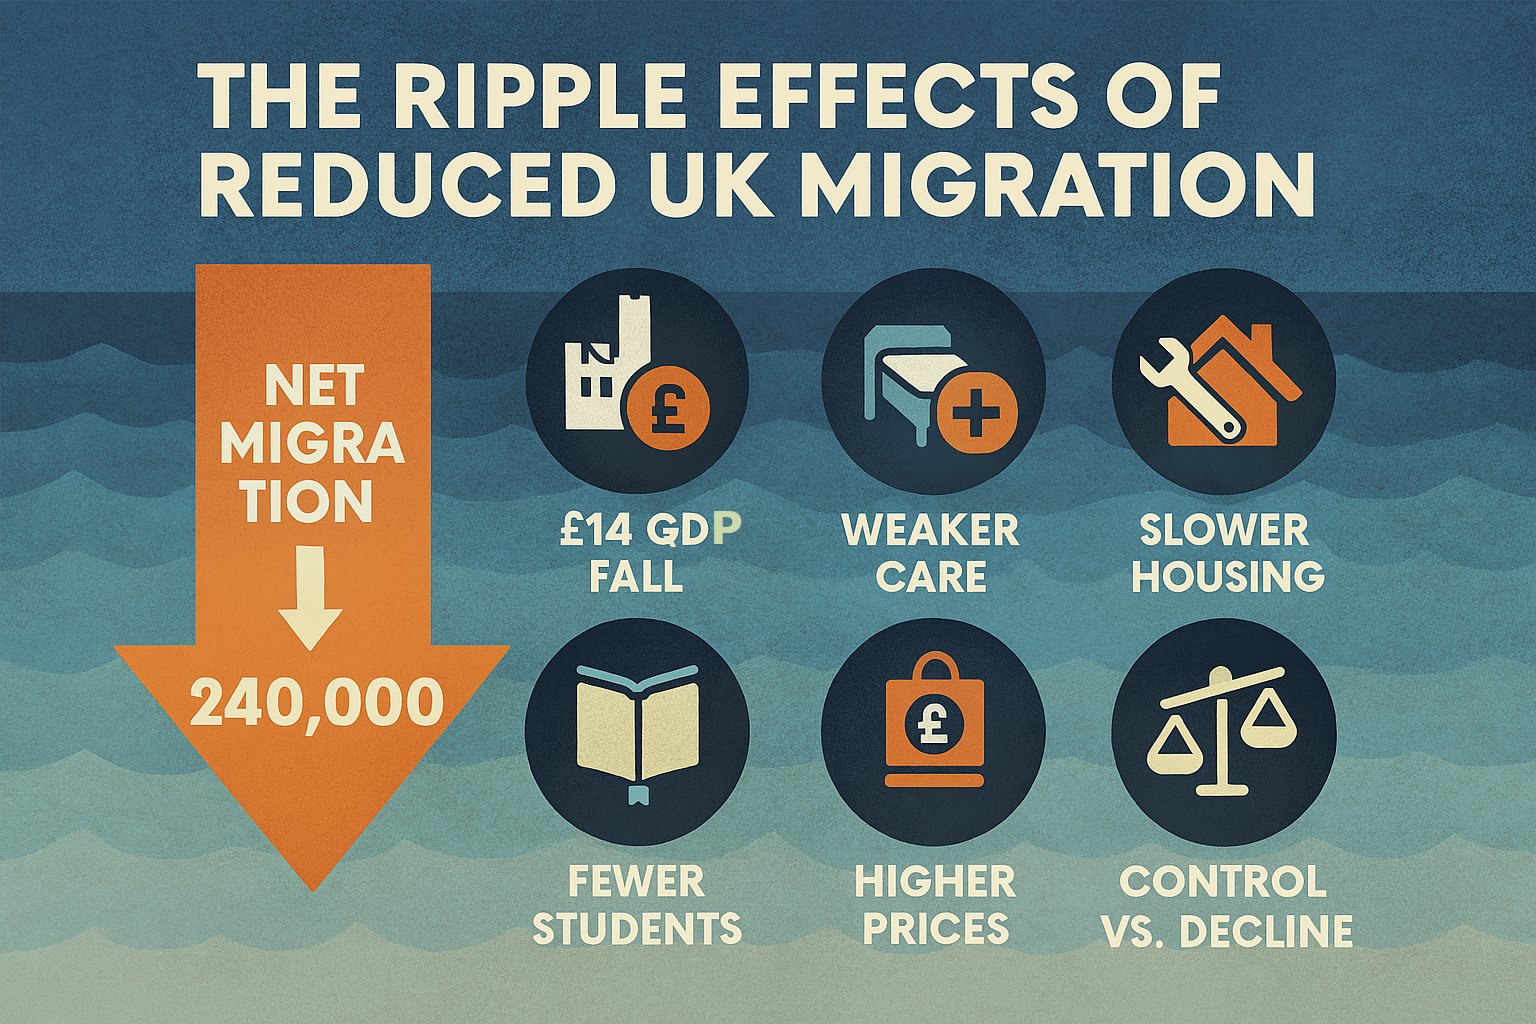
Net migration to the UK fell dramatically to 204,000 in the year to June 2025, down from 444,000 the previous year, a decrease of 240,000 people according to the latest ONS data. While political attention remains fixated on small boats and summer riots, this sharp decline in legal migration is quietly reshaping the UK economy in ways that will affect every citizen.
The reduction represents far more than a statistical adjustment. It signals a £14 billion reduction in economic output, widespread staffing shortages in essential services, and accelerating demographic challenges that will compound over decades. Yet these profound changes remain largely invisible in public discourse, overshadowed by the dramatic politics of irregular arrivals that represent a tiny fraction of overall migration.
📊 The Numbers Behind the Headlines
- Net migration fell from 444,000 (year to June 2024) to 204,000 a 240,000 decrease (ONS, June 2025)
- Immigration dropped from 1.3 million to 898,000 people annually
- Emigration rose from 650,000 to 693,000 as more people left the UK
- Economic impact: approximately £14 billion in lost GDP (using the shorthand multiplier)
- Small boat arrivals represent less than 2% of total immigration flows
📈 The Fiscal Mechanics: Understanding the GDP Impact
The Office for Budget Responsibility’s modelling shows that migration changes directly affect labour supply and GDP. Analysts often approximate that every 100,000 change in net migration can shift output by several billion pounds, though the actual impact depends on age, skills, and fiscal contribution. The recent fall of 240,000 in net migration could plausibly reduce GDP by tens of billions, with knock on effects for public services and long term fiscal sustainability.
OBR's Migration GDP Relationship
💷 Economic Impact Calculation
Migration Change: -240,000 people (year to June 2024 → June 2025)
Illustrative GDP Impact: –0.72% (240,000 ÷ 100,000 × 0.3%)
Economic Output Lost: Approximately £14 billion annually (Analysts estimate)
Context: Roughly equivalent to the Home Office budget
Why Migrants Boost GDP
The positive relationship between migration and economic output reflects several key factors:
- Age Profile: Migrants are typically younger and more economically active than the general population
- Skills Mix: Both high skilled professionals and essential workers fill critical gaps
- Fiscal Contribution: Working age migrants are net contributors to public finances
- Consumer Demand: More residents means more spending on housing, food, services, and goods
- Innovation Effect: International talent drives productivity and entrepreneurship
Institute for Fiscal Studies Analysis
The IFS has consistently shown that reduced migration worsens long term fiscal sustainability by eroding the tax base, raising dependency ratios, and reducing economic dynamism.
- Tax Base Erosion: Fewer working age taxpayers supporting public services
- Dependency Ratio: More pensioners per worker as population ages
- Debt Trajectory: Higher debt to GDP ratios without migrant taxpayers
- Service Costs: Same public service demands with fewer people to pay for them
- Growth Potential: Reduced economic dynamism and innovation
🏥 Public Services: The Staffing Crisis Deepens
The reduction in migration is exacerbating critical staffing shortages across public services, with immediate consequences for service quality and availability.
NHS Workforce Dependence
The NHS's reliance on international workers makes it particularly vulnerable to migration reductions:
15.3%
of all NHS staff are non-UK nationals (ONS, 2024)
28%
of doctors trained outside the UK (GMC, 2024)
165,000
current NHS vacancies across England (NHS England, 2025)
Upto 50%
of care home workers in some regions are overseas born (Skills for Care, 2024)
Migration Advisory Committee Warnings
The MAC reports have repeatedly concluded that health and social care sectors face service collapse without adequate migration:
- Care Sector Crisis: Adult social care facing 165,000 vacancies even before migration reduction
- Rural Healthcare: Rural areas particularly dependent on overseas healthcare workers
- Specialist Skills: Shortage occupation lists growing longer as recruitment becomes harder
- Training Gaps: Domestic training capacity insufficient to replace overseas workers
- Service Rationing: Reduced staffing leading to longer waiting times and service restrictions
Local Government Association Evidence
The LGA submissions to Parliament highlights how reduced migration affects local service delivery:
- Care Services: Rising demand for elderly care with fewer available workers
- Children's Services: Social workers and care staff increasingly difficult to recruit
- Housing Support: Reduced capacity to help with homelessness and housing stress
- Environmental Services: Waste collection and street cleaning affected by staffing gaps
- Community Centers: Library and leisure services reduced due to staff shortages
🏗️ Infrastructure and Housing: The Construction Paradox
The migration reduction creates a paradoxical situation in housing and infrastructure: policies intended to ease demand pressure actually worsen supply constraints.
Construction Industry Training Board Analysis
CITB forecasts reveal the critical role of migrant workers in construction:
- Skills Shortages: 270,000 additional construction workers needed by 2028
- Migrant Dependence: 15% of construction workforce born outside the UK
- Specialized Skills: Migrant reliance is particularly high in trades like plumbing, electrical, and civil engineering
- Regional Variation: London and South East particularly dependent on overseas workers
- Training Time: 3-5 years to train domestic replacements for skilled construction roles
Housing Delivery Impact
Reduced construction workforce directly affects housing supply:
- Build Rates: House building already below government targets, further slowed by workforce shortages
- Cost Increases: Labor shortages driving up construction costs and house prices
- Quality Issues: Skills gaps risk affecting build quality
- Regional Imbalances: Areas with fewer migrants seeing even slower housing development
- Infrastructure Projects: Major transport and energy projects delayed by skills gaps
The Infrastructure Irony
The policies designed to ease demand pressure by reducing migration inadvertently worsen supply constraints, driving up costs and slowing delivery.
🔄 The Housing Paradox
Intended Effect: Reduce migration → Less housing demand → Lower house prices
Actual Effect: Reduce migration → Fewer construction workers → Slower house building → Higher house prices
Result: Housing becomes less affordable despite fewer people needing homes
🎓 Knowledge Economy: Universities and Innovation Under Pressure
The reduction in international students and skilled migrants represents a significant blow to the UK's knowledge economy and long-term competitiveness.
Universities UK Economic Impact
UUK's analysis reveals the scale of international student contribution:
- Economic Value: International students contribute £41 billion annually to UK economy (UUK, 2023)
- Tuition Revenue: £12 billion in direct university income from international fees
- Local Spending: £13 billion spent by students in local communities
- Job Support: 300,000 jobs supported by international student spending
- Export Earnings: Education as UK's fourth largest export industry
Higher Education Policy Institute Analysis
HEPI research shows how student reductions affect research and innovation:
- Research Funding: International postgraduates essential for research project funding
- Innovation Networks: Reduced international connections weakening UK research links
- Skills Pipeline: Fewer international students means fewer staying for skilled work
- University Finances: Some institutions facing severe financial pressures from reduced international revenue
- Global Rankings: UK universities' international competitiveness at risk
British Council Soft Power Impact
The British Council highlights broader consequences for UK influence:
- Global Networks: Reduced alumni networks in key international markets
- Cultural Influence: Fewer people with positive UK educational experiences
- Trade Relationships: Education links often precede business partnerships
- Diplomatic Connections: International students often become future leaders
- Language Spread: English language influence reduced by fewer UK educated speakers
🍽️ Everyday Economy: From Cafés to Care Homes
The migration reduction is felt most immediately in everyday services that depend on international workers to function.
UKHospitality Staffing Crisis
The UKHospitality surveys show the sector faces acute staffing challenges:
- Vacancy Rates: 174,000 unfilled positions across hospitality sector
- Service Restrictions: Restaurants reducing opening hours due to staff shortages
- Quality Impact: Longer waiting times and reduced service standards
- Price Increases: Higher wages for remaining staff driving up menu prices
- Business Closures: Some establishments closing permanently due to staffing challenges
National Farmers' Union Warnings
The NFU highlights agriculture's dependence on seasonal and permanent overseas workers:
- Seasonal Labor: 80,000 seasonal agricultural workers needed annually
- Harvest Risks: Crops left unharvested due to labor shortages
- Food Security: Increased reliance on food imports as domestic production falls
- Price Impact: Labor shortages driving up food costs for consumers
- Regional Effects: Rural economies particularly affected by agricultural labor gaps
Consumer Impact
Everyday services across the economy feel the strain:
- Café and Restaurant Closures: Earlier closing times and reduced weekend opening
- Care Home longer Waiting Lists: Reduced capacity as staff shortages limit bed availability
- Retail Service Reductions: Longer queues and reduced customer service
- Cleaning Services: Office and commercial cleaning becoming more expensive
- Delivery Delays: Shortage of delivery drivers affecting online shopping
📊 Long-Term Demographics: The Aging Challenge
The migration reduction accelerates demographic challenges that will reshape the UK economy over the coming decades.
ONS Population Projections
The ONS projections suggest how reduced migration affects long term demographics:
🔢 Demographic Shifts by 2050
With Current Migration Levels
- Working age population: 62% of total
- Dependency ratio: 61 dependents per 100 workers
- Pension cost: 12% of GDP
With Reduced Migration (204k annually)
- Working age population: 58% of total
- Dependency ratio: 72 dependents per 100 workers
- Pension cost: 15% of GDP
OBR Fiscal Sustainability Analysis
The OBR long term fiscal reports warn that reduced migration worsens long-term fiscal sustainability:
- Pension Pressure: Fewer workers to support growing pensioner population
- Healthcare Costs: Aging population requiring more expensive care
- Tax Base Erosion: Smaller working population to fund growing spending needs
- Debt Trajectory: Higher debt to GDP ratios without migrant taxpayers
- Growth Potential: Slower economic growth with shrinking workforce
Resolution Foundation Regional Analysis
The Resolution Foundation shows how reduced migration affects different areas:
- London Impact: Reduced growth and innovation as international talent chooses other cities
- Regional Towns: Risk of population decline and economic stagnation
- University Cities: Economic pressures as international student numbers fall
- Rural Areas: Accelerated aging and service closure without young workers
- Industrial Regions: Difficulty attracting investment without available workforce
🎭 Perception vs Reality: The Small Boats Distraction
While political attention focuses intensely on small boat arrivals, these represent a tiny fraction of total migration flows, creating a massive disconnect between public debate and economic reality.
Home Office Data Reality Check
Official statistics reveal the scale disparity:
📈 Migration Flows: The Real Numbers
Legal Immigration: 898,000
- Work visas: 423,000
- Study visas: 379,000
- Family reunification: 96,000
Small Boat Arrivals: ~18,000
- 2% of total immigration
- 0.03% of UK population
- Equivalent to the population of a small town
Reuters Institute Media Analysis
Reuters Institute studies shows massive disproportion in coverage:
- Coverage Bias: Small boats receive 60% of migration coverage despite being 2% of flows
- Visual Impact: Dramatic boat footage dominates TV news over economic statistics
- Emotional Framing: 'Crisis' and 'invasion' language for tiny numbers
- Policy Distortion: Disproportionate political attention to irregular arrivals
- Economic Invisibility: GDP impact and service effects receive minimal coverage
IPPR Policy Trade-Off Analysis
The Institute for Public Policy Research identifies the political dynamic:
- Visible vs Invisible: Politicians respond to visible irregular migration by restricting invisible legal routes
- Political Incentives: Credit claimed for 'controlling' borders while economic costs remain hidden
- Perception Management: Public anger about small boats addressed through legal migration restrictions
- Economic Costs: Long term prosperity traded for short term political control
- Unintended Consequences: Policies designed for irregular migration affecting essential workers
🏛️ The Political Economy of Migration Reduction
Understanding why migration fell requires examining the policy decisions that prioritized political messaging over economic evidence.
Policy Drivers Behind the Decline
Several government policies contributed to the 240,000 reduction:
- Student Visa Restrictions: Dependents banned, post-study work routes limited
- Salary Thresholds: Minimum earnings requirements raised for work visas
- Immigration Health Surcharge: Additional charges on overseas health workers
- Family Visa Restrictions: Higher income requirements for family reunification
- Seasonal Worker Limits: Caps on agricultural and hospitality workers
Electoral Calculations
The policy choices reflect short term electoral considerations:
- Voter Priorities: Polling shows immigration as top concern despite economic dependence
- Media Pressure: Tabloid coverage demanding action on migration numbers
- Opposition Positioning: Parties competing to appear 'toughest' on immigration
- Symbolic Politics: Visible policy action valued over economic outcomes
- Interest Group Influence: Anti migration political pressure outweighs business concerns
Economic vs Political Logic
The tension between economic needs and political demands creates policy contradictions:
🔄 Policy Contradictions
Economic Evidence Says:
- NHS needs 165,000 more workers
- Construction needs 270,000 more workers
- Universities lose £41bn without international students
- GDP falls £14bn with fewer migrants
Political Response:
- Restrict healthcare worker migration
- Limit construction worker visas
- Reduce international student numbers
- Political messaging frames reduction as success
🌍 International Competitiveness: Losing the Global Race
While the UK restricts migration, competitor countries are actively attracting the same workers and students, potentially providing them with long term competitive advantages.
Competitor Country Strategies
Other developed nations are capitalizing on UK restrictions (policy changes in 2024–25):
- Canada: Increased immigration targets, fast-track healthcare worker programs
- Australia: Expanded skilled migration, priority processing for healthcare workers
- Germany: EU Blue Card expansion, recognition of foreign qualifications
- Netherlands: English language universities attracting UK-bound international students
- Ireland: Graduate visa schemes and startup-friendly immigration policies
Skills Drain Evidence
Early evidence suggests talent flowing to more welcoming destinations:
- Healthcare Workers: NHS trained doctors emigrating to Canada and Australia
- International Students: Applications to Canadian and Australian universities rising
- Tech Workers: Startup entrepreneurs choosing Berlin and Amsterdam over London
- Researchers: Academic talent moving to universities with better visa policies
- Financial Services: Banking professionals relocating to Dublin and Frankfurt
Long-term Competitive Risk
The migration reduction may risk undermining UK competitiveness for decades:
- Innovation Capacity: Fewer international entrepreneurs and inventors
- Skills Base: Domestic workforce insufficient for growing economy
- Global Networks: Reduced international connections and partnerships
- Investment Attraction: Companies locating where they can recruit internationally
- Reputation Damage: UK seen as less welcoming to international talent
💡 Hidden Costs, Real Consequences
The 240,000 reduction in net migration is not just a statistical shift, it marks a fundamental change in the UK’s economic trajectory. While political debate fixates on small boats carrying a few thousand people annually, the country quietly sacrifices £14 billion in output and essential workers across every sector.
The consequences are already visible: longer NHS waiting lists, housing projects delayed by worker shortages, restaurants closing early, and universities losing international students. These are not isolated problems but symptoms of a single policy choice restricting legal migration in response to irregular arrivals that represent only 2% of total flows.
The long term risks are even greater. As the UK’s population ages and competitor countries actively recruit international talent, the window for reversing these trends is closing. Nations that welcome migrants today will secure decades of economic and demographic advantage, while those that turn them away face accelerating decline.
At the heart of current strategy lies a damaging contradiction: restricting the legal migration that sustains growth in order to address public concern about irregular arrivals that barely register in national statistics. This triumph of perception over reality threatens the UK’s competitiveness and prosperity.
The choice is stark. Britain can continue prioritising political optics while accepting economic stagnation, or it can recognise that prosperity depends on remaining open to international talent and essential workers. Every empty NHS position, every delayed infrastructure project, every student choosing another country represents not just an immediate loss, but a lasting disadvantage in the global race for talent and investment.
The question is whether leaders will confront these hidden costs before they become irreversible or continue celebrating reductions while the foundations of UK prosperity quietly erode.