AI Use & Transparency: AI tools were used to support source discovery and to structure the article for clarity. All research, verification, drafting, and final editorial decisions are fully human led. Learn about our AI policy.
UKPoliticsDecoded is an IMPRESS regulated public interest publisher. Read our editorial standards.
Most of us only think about the electricity system when something goes wrong. A grid warning makes the news. Prices jump. MPs start arguing about Net Zero, renewables or energy security. Then the story fades and the grid slips back out of sight.
The debate is loud. The data underneath it is harder to find.
I find myself thinking about that a lot. The information on generation, carbon intensity and grid conditions is out there, but it lives across technical dashboards and industry datasets built for specialists. For a journalist on deadline or a reader who is simply curious, assembling the picture is a chore.
So we built the UKPoliticsDecoded National Grid Tracker. It is live now.
Why a National Dashboard Isn't Enough
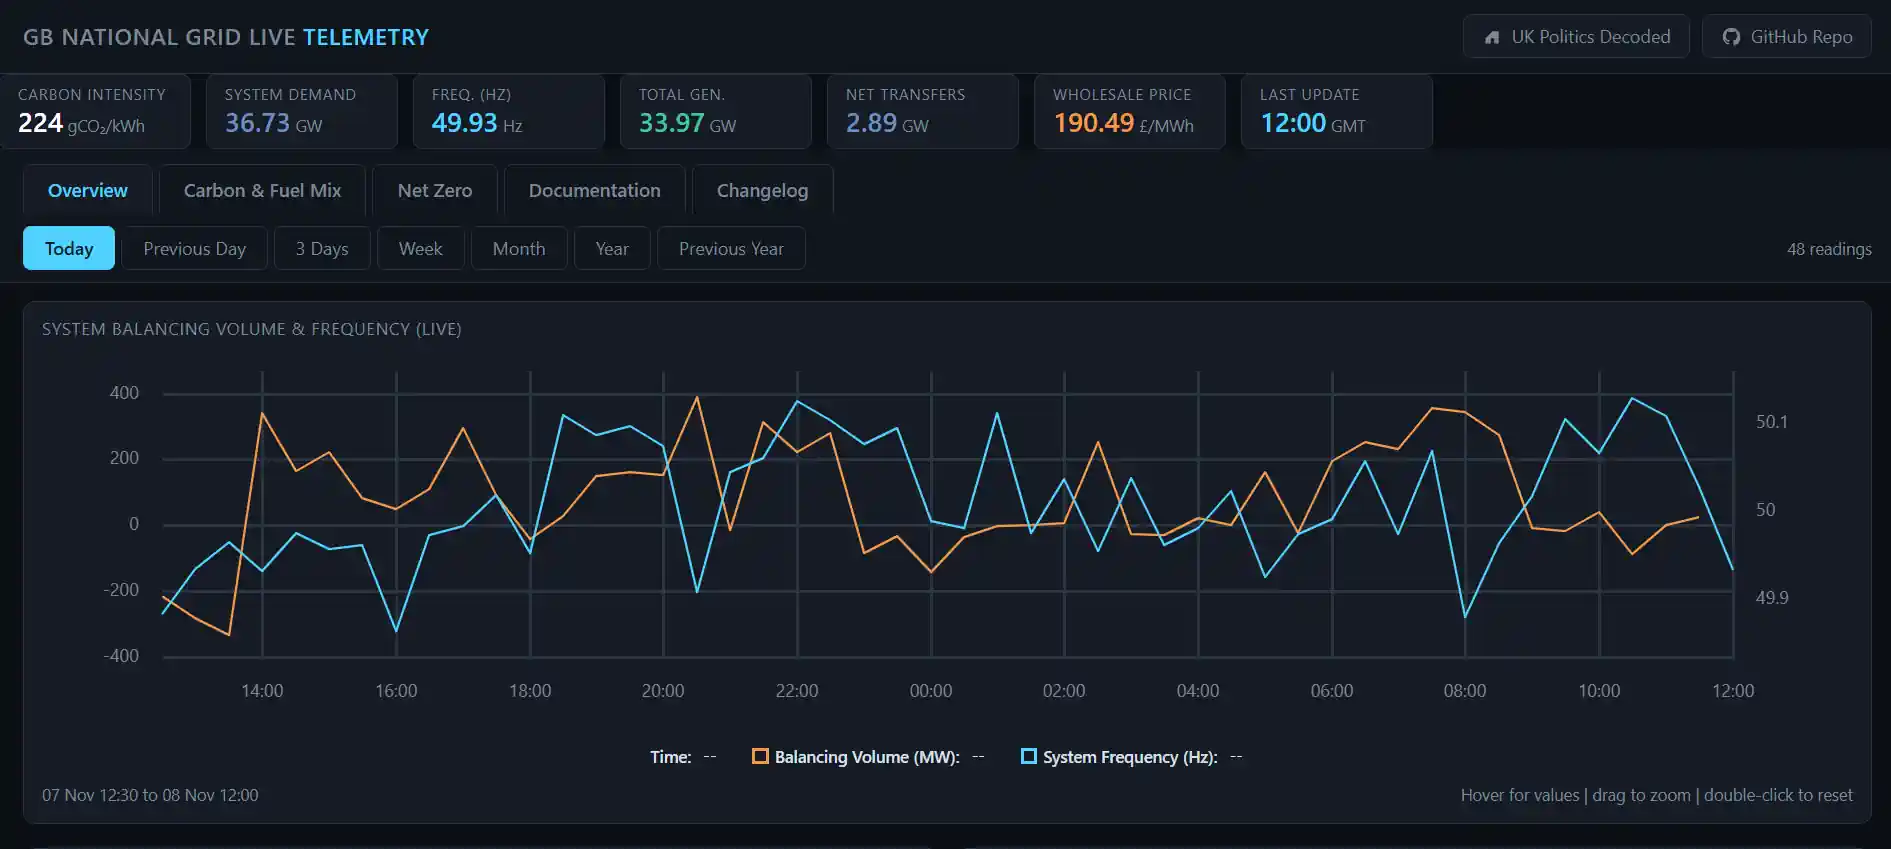
Plenty of dashboards will tell you what is powering Britain as a whole. Demand, total generation, the overall fuel mix. All useful.
But the electricity system is regional. The carbon intensity of power can differ sharply from one part of the country to another, and the networks delivering it do not all lean on the same fuels. What affects one region does not necessarily affect the next.
The Tracker tries to fill that gap. Alongside the national figures, it shows where things are happening, which is often the first step towards understanding why.
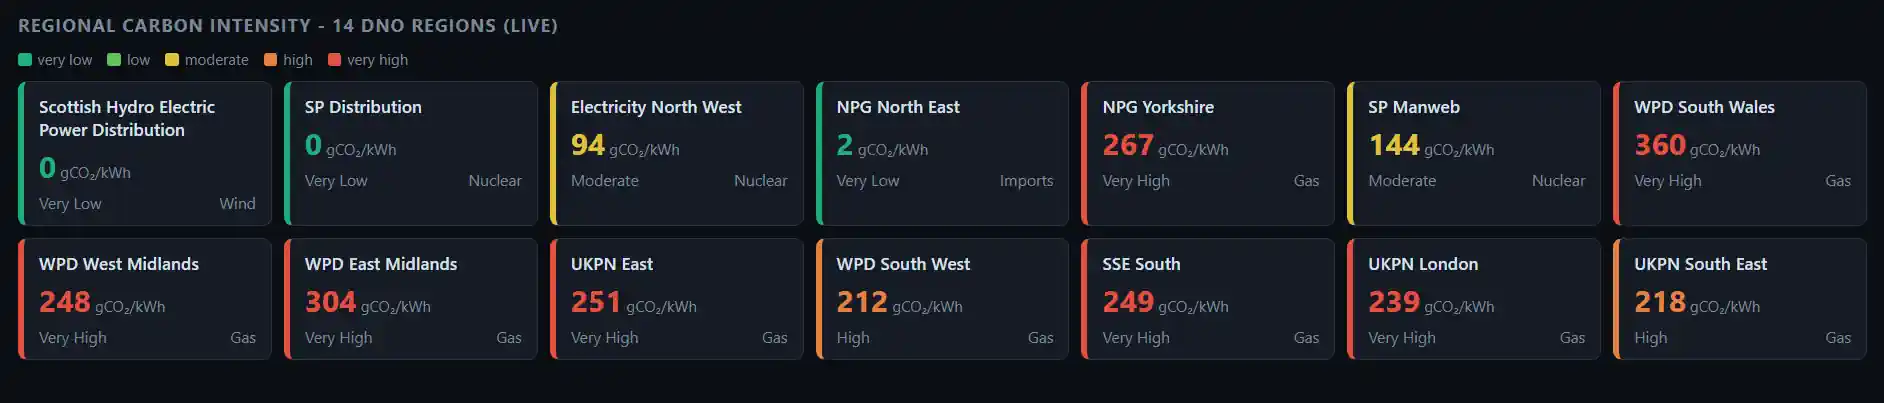
Carbon Intensity Across Britain's 14 Regions
The feature I care about most is the regional emissions view. It maps carbon intensity across Britain's 14 Distribution Network Operator (DNO) regions, measured in grams of carbon dioxide per kilowatt hour (gCO₂/kWh), and updates as conditions change.
A single national average smooths over all of that variation. Regional figures put it back.
That matters in a political climate where decarbonisation is argued over constantly, often in national terms. A region by region picture is a better test of the claims being made.
What Is Actually Powering Your Region?
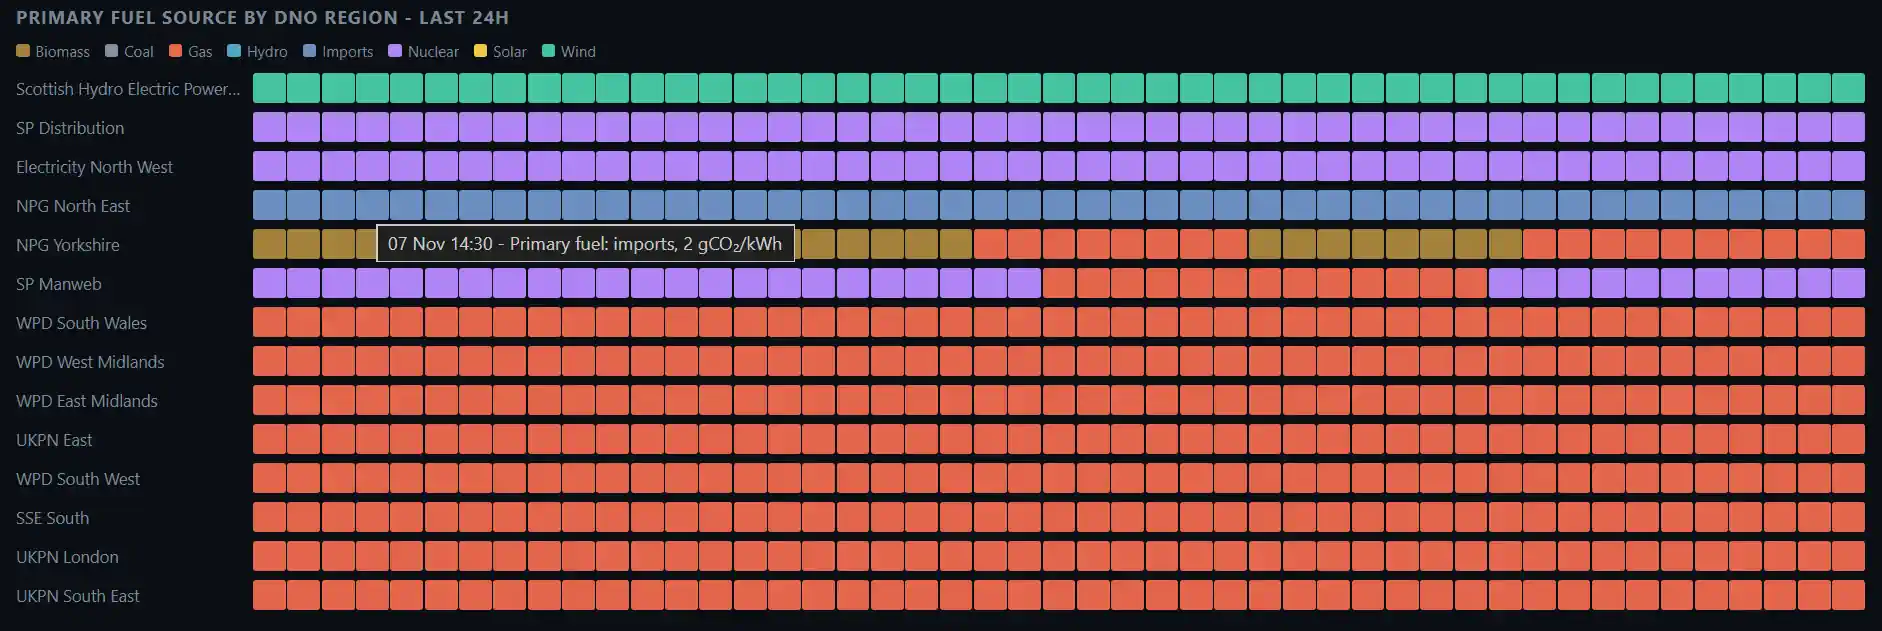
National fuel mix statistics explain what keeps Britain's lights on overall. They rarely say anything about your postcode.
The Tracker includes primary fuel source information for each DNO region, covering both the previous day and the last 24 hours. You can see whether a region leaned mostly on gas, wind, nuclear or something else.
That is useful context for arguments about energy security, regional infrastructure and renewable rollout. It is hard to judge a policy if you cannot see what it is replacing.
Watching the Grid in Real Time
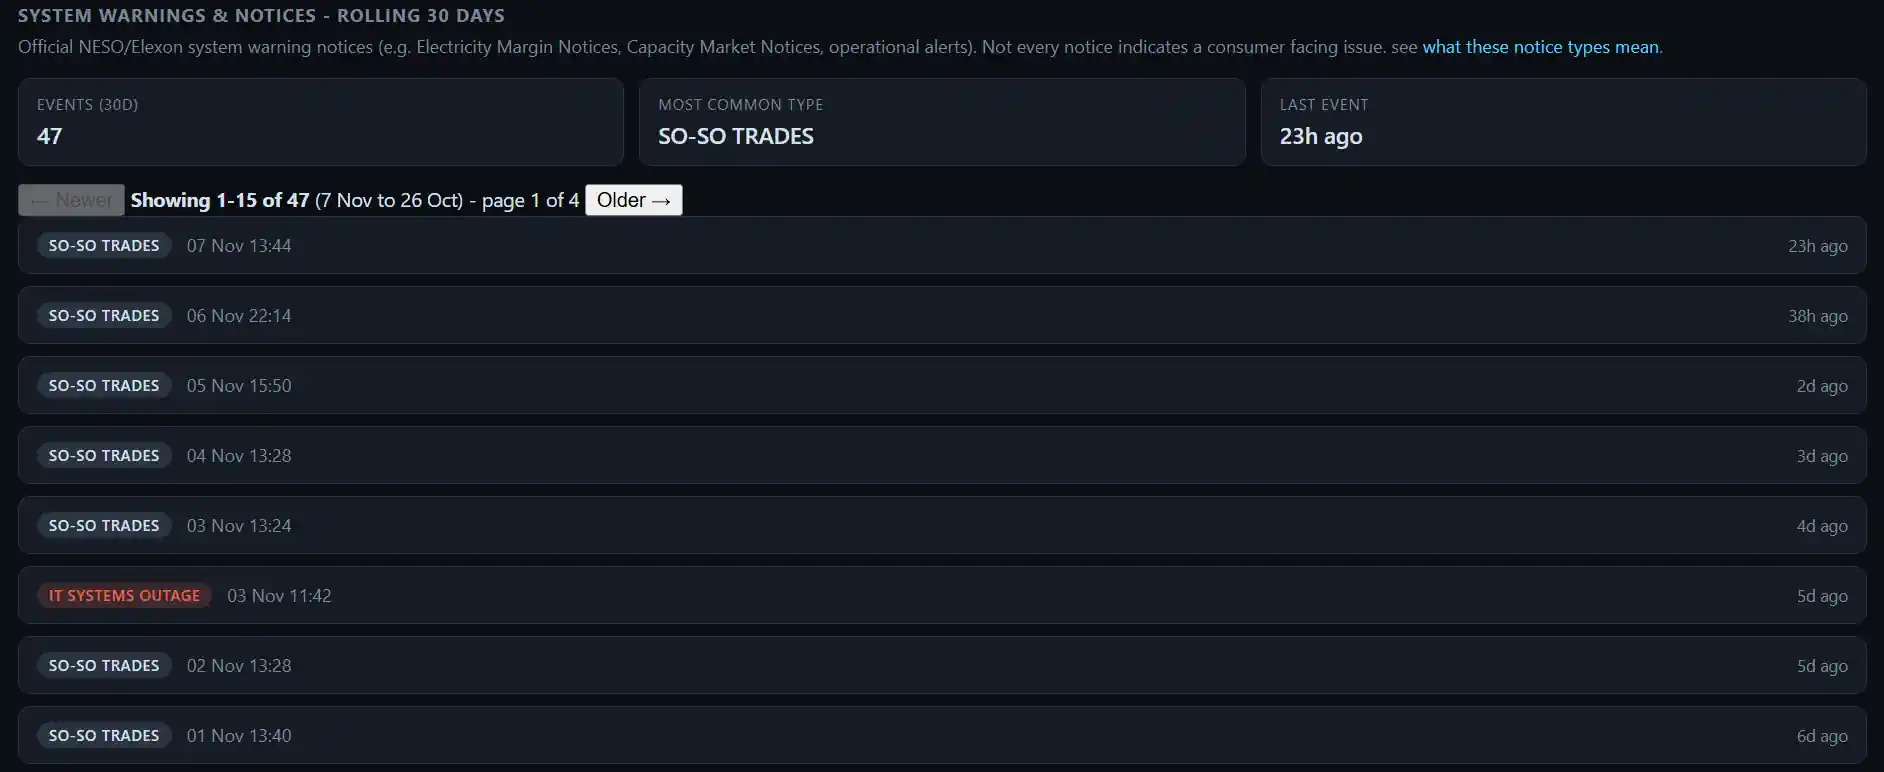
The dashboard also carries wholesale electricity prices, system demand and frequency, and a feed of official NESO and Elexon system notices, such as Electricity Margin Notices and operational alerts.
Those notices are easy to misread. Not every one signals a problem for consumers, and the page says so. Seeing them next to live generation and price data gives them some context.
For reporters and researchers, that can mean spotting a story before it becomes a headline.
From Reporting Energy Policy to Showing the Evidence
The Tracker is part of a wider change in how we think about UKPoliticsDecoded. News, analysis and commentary stay at the centre. But public debate is stronger when people can check the evidence themselves.
Rather than only writing about energy policy, prices or grid warnings, we wanted readers to reach the underlying information directly. Our recently launched MP Lookup Tool, which brings together voting records, attendance and committee memberships, follows the same instinct.
In both cases the aim is plain, make public information easier to find, understand and verify.
What the Tracker Is Not
It is not a replacement for official industry systems, and I would not want anyone to treat it as one. It is a window onto data, not the system of record. If a figure matters to a decision, check it at source.
Energy security, decarbonisation, infrastructure investment and electricity prices will stay near the top of the political agenda for years. More datasets and features are already planned.
UKPoliticsDecoded began with a modest belief that important public information should not be hard to find or hard to understand. The Tracker is another step in that direction. Have a look at your own region, and see whether it matches what you assumed.